
Orcher · Component 07 of 07
Observability
Real-time cross-provider trace: which model, which role, what cost, what outcome.
Layer 2 — continuous, non-blocking

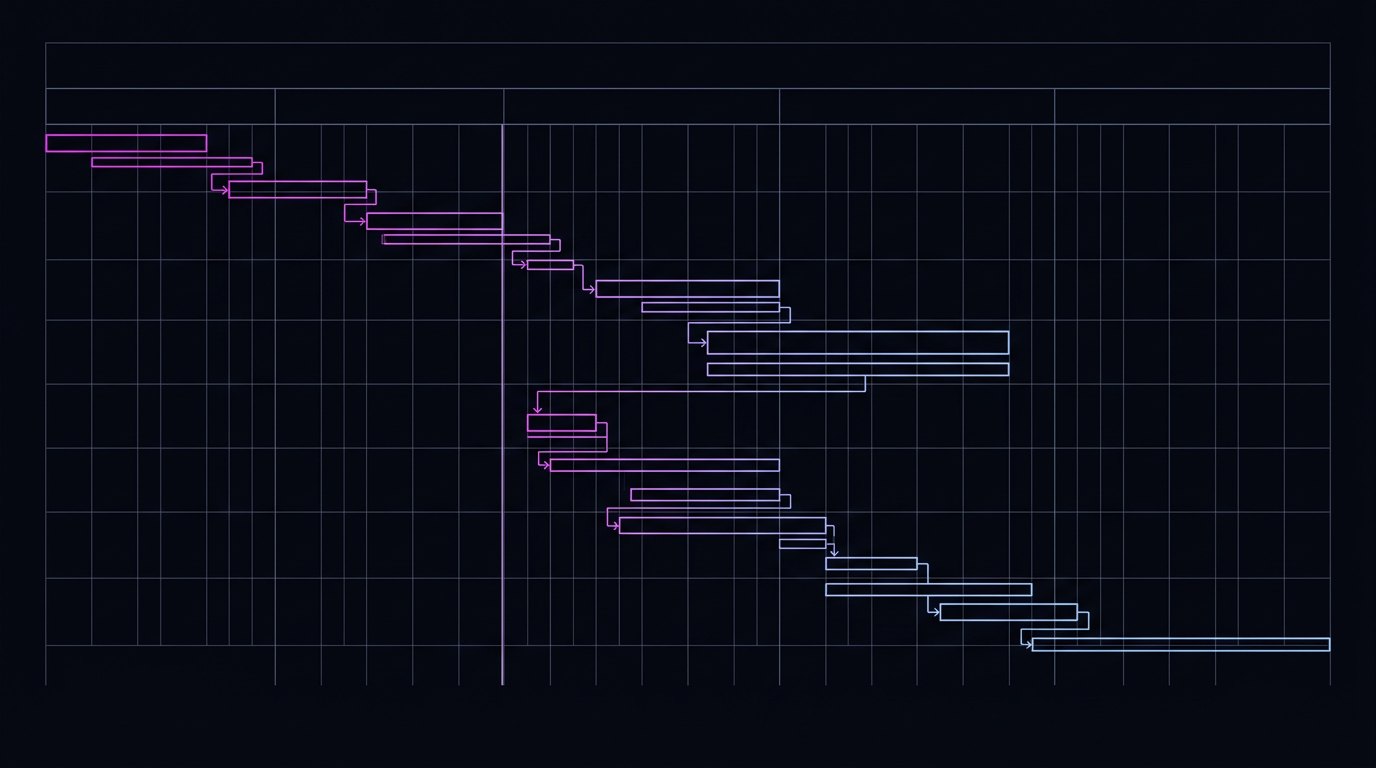
Orcher observes execution across providers, not inside one vendor's console. Every directive can be traced end to end: the role that authorized it, the models it touched, the verifications it passed, what it cost, and what changed in the systems of record as a result.
- Traces a directive across every provider and agent that touched it.
- Surfaces cost, latency, and verification outcome on the same timeline.
- Detects behavior drift against the role's authorized envelope.
- Feeds Dipp Intelligence with the verified path that produced the outcome.
Without it, you see one vendor
Single-provider dashboards cannot show the cross-provider path an enterprise directive actually takes, which is precisely where accountability disappears.
What it emits
OUT.B — Dipp Intelligence: the verified execution path, retained by the firm.
Evidence
What the record shows
Figures drawn from the Enterprise Superintelligence Report, Vol. I, August 2026.
28%
of organizations can trace an agent action end to end
Vol. I, p.6
~60%
cannot terminate an agent mid-execution
Vol. I, p.7
Mechanism
How it works
Four stages, in order. Layer 1 components gate execution; Layer 2 components run continuously and never block.
01
Trace across providers
Execution is observed at the control plane, so a directive that touches three providers produces one trace rather than three disconnected vendor consoles.
02
Bind telemetry to the cycle
Every span carries the directive, the role, the verification result, and the cost, so telemetry is queryable by authority and outcome, not just by service.
03
Surface drift
Halt rates, verification failures, routing mix, and cost per Verified Execution Cycle are tracked continuously. Drift shows up as a trend, not as an incident.
04
Feed the record
Observability is non-blocking by design: it never gates execution, and its output is attached to the ledger record rather than stored in a parallel system.
Operational contract
- Input
- Execution telemetry from every component and provider
- Output
- End-to-end trace per directive, plus fleet-level metrics
- Mode
- Layer 2 — continuous, non-blocking
- Unit of measure
- Verified Execution Cycles — cost, latency, and halt rate per cycle
- Scope
- Cross-provider and cross-agent, including multi-agent handoffs
- Export
- OpenTelemetry-compatible spans into existing observability estates
What it is not
It is not a gate
Layer 2 components never block execution. If observability degrades, work continues and the gap is recorded — the opposite of the Layer 1 posture.
It is not one vendor's console
Provider dashboards see their own calls. Neither the directive nor the role that authorized it is visible from inside a single vendor's view.
Failure behaviour
Degraded telemetry is recorded as a gap in the cycle rather than a halt. Execution integrity is Layer 1's responsibility; visibility loss is never allowed to stop verified work.
Questions
What enterprises ask first
- Does this replace our observability platform?
- No. Spans are exported in an OpenTelemetry-compatible form into the estate you already run. What Orcher adds is the directive and role dimension that platform has no way to obtain.
- What is a Verified Execution Cycle?
- One directive taken end to end: stated, role-bound, verified, committed, and hashed. It is the unit Orcher measures cost, latency, and reliability against.
- Can we see multi-agent handoffs?
- Yes. Handoffs between agents are spans within the same directive trace, which is the only way to attribute a failed outcome to the step that caused it.
- Is any of this personally identifying?
- Traces name the authorizing role and person because accountability requires it. Payload content is governed by the Data Control Gateway and is not duplicated into telemetry.
Where it shows up
Solutions and industries that depend on this
Surfaced automatically from the components each solution engages and each industry relies on.
Solution
Cost discipline & intelligent routing
Route by the stakes of the action, not the habits of the developer.
Solution
Data control & residency
Verify where data goes before it goes there.
Solution
Elastic compute
Utilization is a governance outcome, not a procurement problem.
Use case
Banking & Financial Services
Supervised institutions need evidence, not dashboards.
Use case
Retail
Margin decisions at machine speed still need an owner.
Use case
Manufacturing
Physical consequence closes the loop on digital authority.
The other six
Orcher is one control plane
Layer 1
Directive Interface
Plain language becomes the permanent record of what was asked.
Layer 1
Role Identity Fabric
Binds the directive to a human and a role, cryptographically and revocably.
Layer 1
Logic Scrubber
Verifies the proposed action against systems of record before commit.
Layer 1
Immutable Audit Ledger
Hashes the verified action permanently. Evidence, not logs.
Layer 2
Data Control Gateway
Training exclusion and residency verified before routing.
Layer 2
Cost Governance
Routes by stakes and halts runaway loops.
Verified execution, or none at all.
Orcher is deployed with named enterprises under the Human-in-the-Role model. Request a technical briefing with the founding team.
